A couple weeks ago James Grime linked on Twitter to a puzzle in the January 8, 1981 issue of New Scientist, which runs as follows:
“Beauty? Courage? Generosity? Patience? Wisdom? Which do you wish for the new-born Princess?” asked the Good Fairy.
“Beauty and Wisdom will do nicely, thank you,” replied the King, not wanting to seem greedy.
“Wait! For each gift you name, I shall bestow on her two of the other gifts instead. Each name of a gift triggers a different pair. Each gift is triggered by two of the names. But if you mention both names, they cancel out and she will not get that gift at all.”
“Coo, shiver my sceptre!” exclaimed His Majesty.
“Quite simple! For instance if you ask for Beauty and Courage, she will receive Generosity and Patience. If you ask for Beauty, Generosity and Patience, she will receive those three and Wisdom too. You in fact wished for Beauty and Wisdom. She shall have them, provided you ask for them in the simplest way.”
What gift or gifts should His Majesty ask for?
So we can associate each of the five gifts — let’s denote them by  — with two of the others. Let’s denote this by
  , for example, where
  and
and  are the two gifts triggered by
  . So what we know is

and

Formally, are generators of  ; informally they’re symbols that when added to themselves cancel out. Now, this function
  is a homomorphism from to itself – that is,
 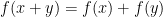 . (This means we can do the cancelling either before or after translating from the language of what was wished for to what actually happens.) So therefore we know
 .
.
Adding these together we get

which gives a way to get both beauty and wisdom — namely, asking for courage, generosity, and patience.
But what’s 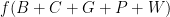 — that is, what do you get if you ask for everything? We have that “each name of a gift triggers a different pair, and each gift is triggered by two of the names”. So we have

since each gift is triggered twice. And the right-hand side there is just zero. So

and we can rewrite this:

But since is a homomorphism that’s just

which is another way of saying  . So in fact
  — that is, to get beauty and wisdom, just ask for them.
To see that this is the simplest possible solution, we need to show that no single gift triggers both beauty and wisdom. I can’t come up with a “clean” way to do this, but we can go brute force. Beauty must trigger wisdom, wisdom must trigger beauty, and beauty and wisdom both trigger the same other gift. This gift can’t be courage – if it were, then we’d have  , but we know
 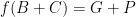 , so adding these we’d have $f(C) = W+C+G+P$, which is impossible. So the “other” gift is either generosity or patience. Repeatedly applying the constraints that every gift can occur twice and the facts we already know, those lead to the solutions

and

respectively, which differ by exchanging  and
and  wherever they appear. In no case is there a single gift with
 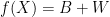 , so the solution is indeed the simplest one.
Note: Jim Randell has been doing programmatic solutions to these puzzles for quite a while now.

 or one in 14,000. (The different denominators correspond to different numbers of times each matchup has occurred, presumably due to changes in the tournament structure;
  ; for all four regions it’s the fourth power of this, about
  .
. .
. .
.
