Links for February 22

Skipped last week because of illness… but we’re back.

How to become a Bayesian in eight easy steps, which is basically an advertisement for the paper of the same name

Stop calling the Babylonians scientists, says Philip Ball regarding the recent discoveries in Babylonian astronomical history.

How Visas Shape the Geopolitical Architecture of the Planet, an analysis of communities among countries based on which countries allow visa-free travel to citizens of which others. Actual paper.

Keith Devlin uses high-dimensional geometry to prove that you are exceptional.

Mike “Pomax” Kamermans has a primer on Bezier curves with both mathematics and demonstrations you can play with.

Junaid Mubeen doesn’t understand his PhD dissertation any more and wonders what this means for mathematics education.

The folks at Vox ask what is the Midwest?, like FiveThirtyEight did two years ago.

Jeremy Kun explains why there is no Hitchhiker’s Guide to Mathematics for programmers.

Milo Beckman uses simulation based on actuarial tables to show why Scalia’s death will be felt through 2060.

How many shuffles suffice in Nevada?

   Ties in Nevada caucuses will be decided by drawing cards from a deck that has been shuffled seven times.  The higher card wins.  (Suit matters – spades are high, then hearts, clubs, and finally diamonds.). I can’t find a source that says if the players draw at random from the deck or if they take from the top (and if they take from the top, who takes first?)

This is a sighting of seven shuffles suffice in the wild. In this case it’s probably overkill, because the whole deck doesn’t need to be well-mixed.

Super Bowl babies don’t exist

On Super Bowl Sunday, I asked if Super Bowl babies exist and suggested that surely data exists to answer this question.

Ashutosh Garg wondered the same thing and actually looked at birth rates in the November following the last 21 Super Bowls in the counties of the teams of the Super Bowl winners.  Looks like nothing’s going on at a population level.

I’m sure there are children that were conceived after their parents’ team won the Super Bowl – the people that the NFL has been showing in its ads are proof of that.  But there does not appear to be a baby “boom”.

(via mic.com)

Links for February 8

When the US Air Force discovered the flaw of averages

An in-depth description of Napier’s bones.

Cathy O’Neil on being an ethical data scientist.

Artisanal integers (not just a page that gives some out – some actual math content here!)

John Allen Paulos talks with Glen Whitney about his new book, which I am ashamed to admit I haven’t read yet.

Brian Hayes on what it takes to put together one of those sites that tells you the properties of a number.

Do Super Bowl babies exist?

So a couple times during the Super Bowl, there have been commercials claiming that there are post-Super-Bowl baby booms – that is, nine months after the Super Bowl, there’s a surge in births in the city of the winning team.

This seems a lot easier to gather data for than some of the other things you hear this claimed about (blackouts, blizzards). Here’s what I could find on those:

This is easily proven or disproven, after the data wrangling (which means, let’s face it, that it’s hard). The NBER appears to have the necessary data (the tropical storm paper above links to it) although I don’t know this data set at all.  Have fun, demographers!

Super Bowl squares with other moduli

People are interested in the odds for the “Super Bowl Squares” game: see for example the Harvard Sports Analysis Collective in 2013 and Mike Beuoy writing for FiveThirtyEight in 2014. The way the game works is as follows:

  • players pay money into a pool.
  • a 10 by 10 grid is made, and the rows and columns are marked 0 through 9.
  • One team’s name is written corresponding to the rows, and the other to the columns
  • the squares of the grid are assigned randomly to the players, proportionally to the amount of money they paid.
  • after each quarter of the Super Bowl, look at the last digit of the number of points each team has scored. This gives a row and a column, and the person who has the corresponding square gets some money (say, one-tenth of the pool)
  • at the end of the game, do the same. The person who has the corresponding square gets a lot of money

This game suffers from a flaw – there are lots of squares that are pretty much worthless, so after the random assignment happens, if you have those squares you won’t win. I couldn’t get quarter-by-quarter data, but below see the number of times that each game score occurred, where the scores are reduced mod 10 (i. e. we look at just the last digit). Data is from pro-football-reference.com.  Obviously using (winner, loser) isn’t exactly the same as using (home team, away team) or some other assignment of teams done before the game, but I don’t think the conclusions here are very sensitive to that.

football-scores-mod-10

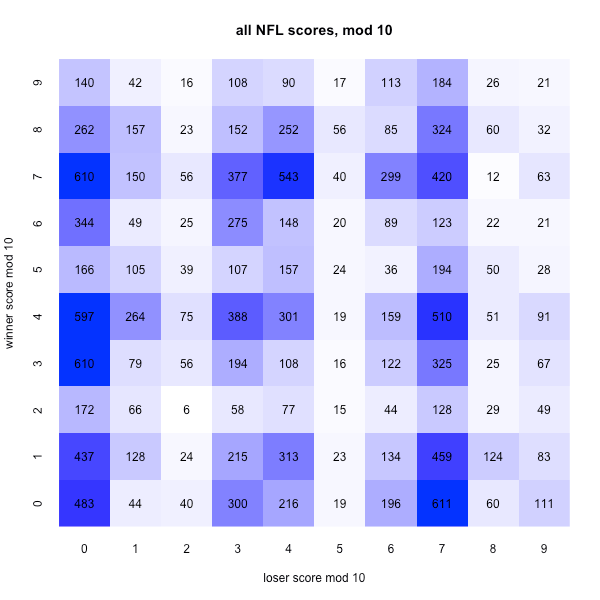
The most common squares are (0, 7) (Note: I’ll refer to squares by (winner score, loser score), which doesn’t agree with the picture but does agree with the way scores are usually read), which occurs 611 times (including the most common single score, 20-17, which has occurred 248 times), and (7, 0) which occurs 610 times (led by 133 occurrences of 17-10 and 102 occurrences of 27-20). On the flip side, (2, 2) has only occurred six times (two games each of 12-12 and 42-32, and one each of 22-12 and 42-22). If you know anything about football, you know that scores come in sevens and threes, for the most part, and this has the property of making certain last digits a lot more common than others.

But there’s an easy fix. What if we play mod 9? Then the distribution of historical scores looks like this:

football-scores-mod-9

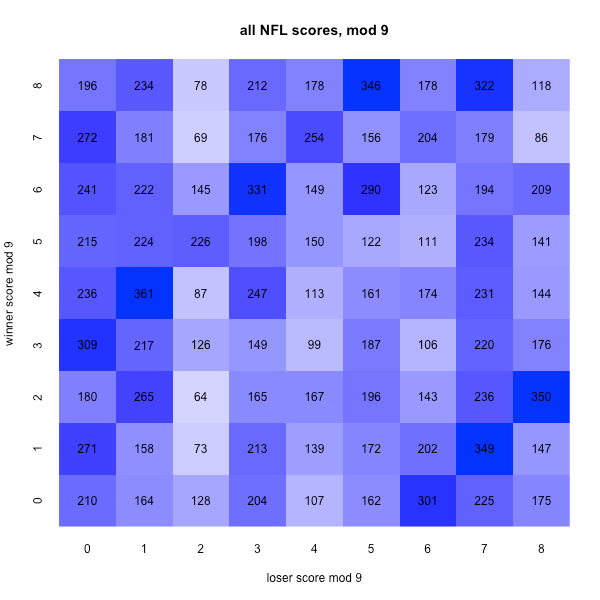
There’s still some unevenness, no doubt about it.  But there aren’t terrifying white gaps signifying scores that never happen.  The most common square is now (4, 1), which occurs 361 times, most commonly as 13-10, 31-28, or 31-10. But even the lowly (2, 2) occurs 64 times in the historical record, most frequently as 38-20, 20-20, or 29-20. (In fact, all but two of the (2, 2) games had at least one team scoring exactly 20.)

And you don’t even have to do division to reduce a number mod 9 – just add the digits of the score up and repeat until you get a single-digit number. 9 counts as 0.

What about if you don’t have a lot of friends and want to do a smaller pool? Mod 6 works well, and has the advantage that you can assign the squares by rolling a die:

football-scores-mod-6

The most common square is (0, 3) (most frequently represented by 24-21 or 30-27) and the least common is (4, 5) (most frequently represented by 28-17 or 34-17, which at least sound like plausible football scores).

But whatever you do, don’t play mod 7:

football-scores-mod-7.png

This is basically a fancy way of beting on how many field goals each team will score: “0” means no field goals, “3” means one field goal, and so on. Also it defeats the purpose of gambling, which is to make the game more interesting – a touchdown plus extra point doesn’t change anything.

Go… um… seriously, I can’t remember who’s playing.  All I know is that the people I know back in San Francisco are complaining and perhaps vandalizing statues.

Links for February 1

Uber vs. taxis simulation and explanation of it from Kevin McLaughlin.

An NFL scheduling quirk explains how certain teams can pile up the wins against weak opponents.

Inside the Wall Street Journal’s prediction calculator (for predicting ethnicity from names).

The recently departed Marvin Minsky on What makes mathematics hard to learn?

From the Notices of the AMS:
George Andrews reports on The Man Who Knew Infinity (the new Ramanujan movie) and the editors explain Gauss curvature.

Gunnar Carlsson at Ayasdi writes on How Topological Data Analysis provides a glimpse into what may be powering the Trump engine.. (This may all make a little more sense – or less – after tonight’s caucuses.)

Richard Nisbett talks to EDGE about what’s wrong with multiple regression analysis.

Erik Bernhardsson analyzed 50,000 fonts using deep neural networks. (It’s like Metafont, but with neural networks and more data.)

John Cook asks what are the next areas of math to be applied?

Nicolas Kruchten at MLDB on machine learning meets economics. (ROC is not the One True Criterion for model evaluation.)

Videos of curve-drawing machines (silent and with little explanation, but oddly hypnotic)

John Pavlus interviews Leslie Valiant on “probably approximately correct” learning and “ecorithms”.

Robert Bosch, Robert Fathauer, and Henry Segerman on numerically balanced dice – that is, many-sided dice that are optimally fair even if they’re physically a bit unbalanced.

Steve Paulson inteviews Frank Wilczek for Nautilus: Beauty is physics’ secret weapon.

Evelyn Lamb shows us an impractical, ahistorical, mathematically elegant way to figure out Earth is a (topological) sphere.

Nick Berry at DataGenetic explains Hamming codes for error correction.