How to flip an election

Another reason Clinton lost Michigan: Trump was listed first on the ballot, by Josh Pasek, University of Michigan. (Disclaimer: I went to middle and high school with Pasek.) From the blog post: “The best estimate of the effect of being listed first on the ballot in a presidential election is an improvement of the first-listed individual’s vote share of 0.31%.” Trump was listed first on the Michigan ballot, because the governor of Michigan is Republican. This study is based on elections in California, which randomizes the order of the candidates on the ballot by precinct. Here’s a preprint of the paper (Pasek, J., Schneider, D., Krosnick, J. A., Tahk, A., Ophir, E., & Milligan, C. (2014). Prevalence and moderators of the candidate name-order effect evidence from statewide general elections in California. Public Opinion Quarterly, 78(2), 416-439.).

Clinton also would have won if the map of the United States looked slightly different. If you want to play around with this yourself, you can redraw the states using the tool by Kevin Hayes Wilson. Move Camden County, New Jersey into Pennsylvania and Lucas County, Ohio (i. e. roll back the Toledo War, which was a thing) into Michigan, and Clinton wins.  Each of these counties is adjacent to the state it’s being moved into. Here’s the resulting map.

I’m pretty sure that two is the minimal number of counties that have to be moved to get a Clinton win, under the constraint that the counties in each state have to remain geographically contiguous. Clinton starts out needing 37 more EV. and the only way to get that by flipping just one state is to flip Texas; but no state adjacent to Texas went blue.  There is a way to make Clinton win that involves moving one county into another state – namely, move Los Angeles County, California into Texas – but that doesn’t seem to be in the spirit.)

The natural question, then, if we want to know how much “unfairness” is due to the electoral college, is something like this: given the actual voting results, and some “random” partitioning of the US into states, what is the probability of a Trump (or Clinton) win? But what does a “random” partitioning of the US into states even mean?  It seems difficult to define this, given that we don’t have a huge number of alternate histories to run, but I’d imagine we’d want to preserve facts like:

  • some states have many more people than others, but no state is much smaller in population than the average congressional district;
  • more populous states tend to be more urban (this is relevant since the electoral college helps low-population states, and one party is more represented in urban areas);
  • states are geographically relatively compact (unlike, say, Congressional districts in some states)

But in the end this is an academic question, because we don’t get to redraw the states.  (Can you imagine the gerrymandering?)

Dressing goes on salad

Someone needs to make a better stuffing vs. dressing map than this one from Butterball. The problem is that they have a small sample: the fine print reads “This survey was conducted online with a random sample 1,000 men and women in 9 regions – all members of the CyberPulseTM Advisory Panel. Research was conducted in May 2007. The overall sampling error for the survey is +/-3% at the 95% level of confidence.” So the average state has a sample of 20, which would lead to a 21% or so margin of error. This error is enough that the map just looks wrong – Georgia and Mississippi call it stuffing, but Alabama and Tennessee call it dressing?  The Butterball map does seem to capture the regional divide, though, where the South calls it “dressing” and the North calls it “stuffing”.  We’re still fighting the linguistic Civil War in my house.  Obviously this is meant to be entertainment, but get a bigger sample, will you?

It looks like Epicurious has some internal data based on search results that led to their site, but they’re not sharing.

My Google Image Search results for “stuffing vs. dressing” find a bunch of pictures of the ambiguously named bready dish, and also this map of the largest religious denomination in US counties and this article on Josh Katz’s maps of Bert Vaux’s dialect survey. “Stuffing” vs “dressing” is not one of the questions in that survey, sadly.

And yes, I know about the compromise where it’s “stuffing” when it’s cooked in the bird and “dressing” when it’s cooked separately. But in my family of origin we generally have too much to fit in the bird, so some gets cooked in the bird and some doesn’t… does that mean we have “dressing” and “stuffing” on the table at the same time?

Use R, vote D?

David Robinson, data scientist at StackOverflow, tweeted:

Of course this is because of a confounder.  Namely, R comes out of the statistics community, which is concentrated in places with universities, which also tend to be pro-Democratic in the current political environment.   Python, he finds, is also anti-correlated with Trump voting; C# and PHP are correlated with Trump voting, he finds:

Interpret this as you will.  (Seriously, I don’t know enough about who uses C# and PHP to comment anywhere near intelligently.)

The data on language usage by county is not public, but the data on voting is, David Taylor has assembled vote counts by county, and David Robinson has some code for manipulating them and making some plots. Fun fact: the county(-equivalent) with the lowest percentage of Trump voters is the one Trump doesn’t want to move to.

A proof that π < 22/7

Note: this proof has a fatal error.

There’s a reasonably well-known proof that 22/7 > \pi, which can be written in one line:

0 < \int_0^1 {x^4 (1-x)^4 \over 1+x^2} dx = {22 \over 7} - \pi 
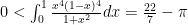
But I’ve always found this one unsatisfying because what does that integral have to do with \pi anyway? As it turns out, \pi enters through the integral \int_0^1 {1 \over (1+x^2)} = \pi/4
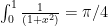
. But let’s say I’m a purist and think that \pi is about circles. Can I do better? (Of course I can. If I couldn’t I wouldn’t be writing this post.) Start by observing that (21/11)^3 > 7, which can be shown by explicit computation: 11^3 = 1331 and 21^3 / 7 = 21^2 \times 3 = 1323.

Edited to add, November 30: of course I just showed here that (21/11)^3 < 7. This is what happens when you do arithmetic in your head…

Now, the sine function is given by the alternating series sin(x) = x - {x^3 \over 3!} + {x^5 \over 5!} - {x^7 \over 7!} + \cdots and in particular \sin(x) > x - x^3/6 by the alternating series test. Applying this with x = 11/21 gives \sin(11/21) > 11/21 - (11/21)^3/6 > 11/21 - (1/7)/6 = 1/2.

Taking the inverse sine of both sides, 11/21 > \sin^{-1} 1/2.

Finally, we have \pi = 6 \sin^{-1} (1/2). This is a geometric fact that goes back to Euclid’s construction of the hexagon. So \pi < 22/7.

On related notes:

  •  Noam Elkies, Why is π2 so close to 10?
  • Alejandro Morales, Igor Pak, and Greta Panova, Why is π < 2φ?  (This is not a particularly good approximation, but it actually admits a combinatorial proof in terms of Fibonacci and Euler numbers.)

Crossword rundown

Kurt Schlosser at Geekwire: How hard is the New York Times crossword?  This is a description of the Puzzle Difficulty Index that Puzzazz, a puzzle solving app, has been calculating.  Unsurprisingly, if you know anything about that puzzle, later-in-the-week crosswords take longer and are less frequently solved (with the exception that a few more people solve on Thursdays than Wednesdays, which I’d attribute to either noise or the fact that Thursday puzzles tend to have some sort of “gimmick” and are not just halfway between Wednesdays and Fridays).  Both links are worth reading, although there’s some redundancy.  I’ve thought for a while that this sort of thing would be possible if I had enough data.

The next frontier in this sort of analysis would be seeing which individual clues are the hardest – what do people solve immediately and what do they leave until the end, when they have a lot of crossing letters?  I’m not sure if crossword constructors would be interested in this, although anecdotally they seem to be a mathy bunch…

Of course, all of this would be irrelevant if crosswords didn’t exist, and it’s not immediately obvious that enough different strings of letters make words that crosswords should be possible.   In his book Information Theory, Inference, and Learning Algorithms, the late David MacKay analyzed this; here’s the relevant excerpt from that book (three-page PDF) and a more elaborated version of the analysis.  This actually goes back to Shannon’s founding paper although he doesn’t give the detailed analysis.  Shannon writes that:

A more detailed analysis shows that if we assume the constraints imposed by the language are of a rather chaotic and random nature, large crossword puzzles are just possible when the redundancy is 50%.

 Here “redundancy” has a specific information-theoretic meaning, and it turns out that the redundancy of English is just around 50%; MacKay’s analysis further shows that crosswords should be harder to construct (i. e. there should be fewer valid ways to fill in a given pattern of black and white squares) as words get longer.
Since I’m talking about crosswords, I’d be remiss if I didn’t point out the famous quote of Tukey:

Doing statistics is like doing crosswords except that one cannot know for sure whether one has found the solution.

Brillinger, in this paper memorializing Tukey, tells us that this quote or something like it came from books of crosswords which he gave to his students as gifts… but from which removed the answers!

And FiveThirtyEight isn’t just election news! Ollie Roeder reported on the American Crossword Puzzle Tournament in 2015.

One-fifth of Americans what?

As you probably know, there’s a (US presidential) election soon.   And there are a whole bunch of people who are predicting the probability that each candidate will win.  But as Nathan Collins has pointed out at Pacific Standardone-fifth of Americans can’t understand election predictions.

My first reaction, upon seeing this, was to think that one-fifth of Americans don’t understand what “one-fifth” means.  (I had just recently come across the old idea that Americans didn’t want a third-pound burger because they thought it was smaller than a quarter-pound burger, so I was primed to think this.)  But of course that’s too meta.

What this really is saying is that people mistake a result from one of these models like “Clinton has a 65% chance of winning the election” for “Clinton will get 65% of the vote”.   I don’t know if there’s direct evidence for this, but:

  • people have trouble interpreting, say, weather forecasts which give a probability of rain.
  • I actually made this mistake a few nights ago when listening to the FiveThirtyEight elections podcast.  For a brief moment I heard “Clinton has a 65 percent chance of winning according to our model”, thought it meant that Clinton had 65 percent of the vote, was happy, then realized that that was inconsistent with the way I’ve been feeling about the election and went back to remembering that Clinton was just a two-to-one favorite.

And if I can make that mistake, surely people who don’t have training in probability can. These examples are actually more similar than you might think: a 30% chance of rain means that there’s a 30% chance that somewhere in the forecast area there will be at least some cutoff amount of rain. Both are the case that some random variable (the difference between the two candidate’s vote percentage, the maximum amount of rain over an area) ends up over some cutoff. And complicated random variables such as these are surely hard to reason about.

Also, probabilities are used as rhetorical devices, not just pure numbers.  On Morning Joe just before the 2012 election, Joe Scarborough said:

Nate Silver says this is a 73.6 percent chance that the president is going to win? Nobody in that campaign thinks they have a 73 percent chance — they think they have a 50.1 percent chance of winning. And you talk to the Romney people, it’s the same thing […] Both sides understand that it is close, and it could go either way. And anybody that thinks that this race is anything but a tossup right now is such an ideologue, they should be kept away from typewriters, computers, laptops and microphones for the next 10 days, because they’re jokes.

What I think Scarborough intended to says here is that everyone in both campaigns acted as if they had a 50.1 percent chance of winning, i. e. they were the favorites to win but by a tiny margin. If you think someone is just on your tail that keeps you motivated. But at that time Obama did have a slight lead in the polls, and therefore was more likely to win the election. (Modulo polling errors, electoral college math…)

Oh, and go vote. But really you didn’t need me to tell you that.