Reverse Anscombe

At Cross Validated, someone asked about why they get wildly different histograms from the same data. The user Glen_b gave an excellent answer based around an example for which data sets which differ from each other just by adding a constant have very different-looking histograms. Other commenters suggest using kernel density estimates or cumulative distribution plots, both of which wouldn’t fail on this particular question.

Anscombe’s quartet comes to mind – four bivariate data sets with the same mean and variance of each coordinate and the same correlation, which look wildly different when plotted. This is sort of a reverse-Anscombe: here data sets that look essentially the same when plotted have wildly different summary statistics.

Weekly links for April 8

From metafilter, mesmerizing visualizations of genetic algorithms.

The paper and pencil cosmological calculator.

Zipfian Academy is offering to train people to become data scientists in twelve intense weeks. (via.)

A prize is on offer for improving prediction of flight delays..

Sebastian Bubeck’s blog on “topics in optimization, probability, and statistics.

A roundup of 100 statistics blogs.

A tumblr of transit maps . (Yes, not really about math -b ut sort of tickles the same part of the brain, no?)

E. O. Wilson on why scientists don’t need math, and Jeremy Fox on why they do.

Pi(e) approximations in practice

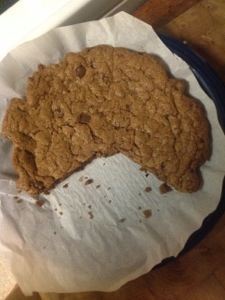
Tonight the God Plays Dice art department made blondies!

These are supposed to be made, according to the recipe, in a pan which is an eight-inch square. But we have no such thing. We do have a nine-inch circular pan, though. Will that do?

Well, what matters is that the two pans have the same area – and therefore that the same volume of batter will have the same thickness and cook roughly the same. (If you thought I was going to solve some PDEs and work out how the heat transfers, you haven’t been paying attention.)

A nine-inch circle has area \pi (9/2)^2 = 81\pi/4 square inches, which is about 63.62. An eight-inch square, of course, has area 64 square inches. Not bad!

What would it take for this approximation to be exactly correct? This would require that 81\pi/4 = 64 exactly; solving for \pi gives $\pi = 256/81″, which is often credited as an Egyptian approximation to \pi as it implicitly appears in the Rhind papyrus, an ancient Egyptian document of,problems in mathematics. In fact the setting in which this is established there is almost exactly this one – a circle of diameter 9 and a square of side 8 are said to have the same area. See for example these slides for a history of math class by Bill Cherowitzo.

This isn’t the greatest approximation of \pi – in fact 81\pi is about 254.46 – but it has the added “virtue” that 256 is a power of two, and 81 is a power of three. We could write \pi \approx 2^8/3^4 – it looks nicer that way, I think.

And because Internet law forbids me from mentioning food without posting a picture of it:

20130404-200557.jpg

Weekly links for April 1

From Decision Science News, Some ideas on communicating risk to the general public.

The Expression of Emotions in 20th Century Books via the Wall Street Journal. Over the course of the 20th century, authors in English used less “mood” words, and this has been stronger in British texts than American ones.

Is predictive modeling different from interpolation?

Wolfram on Mandelbrot (via Gelman)

Network theory approach reveals altitude sickness to be two different diseases.

27-game streak? For Heat, 50-1 shot

The Fifth problem: math & anti-Semitism in the Soviet Union by Edward Frenkel.

A series from Bloomberg on gerrymandering: part one, two, three, and a couple of graphics.

Sampling error in sports and politics

Laura McLay asks why is it so easy to forecast the Presidential election and so hard to forecast the NCAA basketball tournament? Nate Silver famously predicted the winner of all 50 states; but if you look at the NCAA basketball tournament, it’s difficult to get much above the low-70-percent range in predictive accuracy. (Silver himself has pointed this out.)

One thing that’s not mentioned, though, is that a basketball game is simply a smaller sample than voting. The basic unit of basketball analysis is the possession; a typical Division I college basketball game might include 150 or so possesions. (Averages per team are at team rankings.) If you let two basketball teams go at it for hundreds of thousands or even millions of possessions, the chance that the better team would win the game would be much higher.

In short, basketball games are subject to sampling error; voting is not.

Sum of powers of i

James Tanton asks:

What is 1 + i + i^2 + i^3 + i^4 + i^5 + \cdots?

Of course it’s 1/(1-i), right, by the usual formula for summing a geometric series? But this says that

1 + z + z^2 + \cdots = {1 \over 1-z}

when |z|<1.  And |i| = 1, so it doesn’t work here. But who cares? Start taking partial sums. The sum is (after simplifying using i^2 = -1, i^4 = 1):

1 + i - 1 - i + 1 + i - 1 - i + \cdots

and we can write down partial sums: 1, 1+i, i, 0, 1, 1+i, i, 0, \cdots — and the average of this series is $(1+i)/2$, which is $1/(1-i)$. It’s a complex version of Grandi’s series (1 + 1 - 1 + 1 - 1 + 1 \cdots = 1/2), and indeed the argument I’ve outlined here is Cesaro summation.)

Weekly links for March 25

John Cook has an incomplete post about sphere volumes for which he asked for some help in recognizing some familiar formulas.

Andrew Gelman writes for the New York Times on how fast we slow down running longer distances and comments on his blog on where one might get the data.

Peter Cameron has an extended series on Fibonacci numbers: one, two, three, four, five, six, seven, eight.

How to add up quickly, from Plus magazine, on accelerating series convergence.

From Michael Trick, the indiegogo fundraiser of the traveling salesman movie.

On the distribution of time-to-proof of mathematical conjectures, by Ryohei Hisano and Didier Sornette. (I learned about this paper from Samuel Arbesman‘s book The Half-life of Facts: Why Everything We Know Has an Expiration Date.)

Numberphile on statistics on match day as collected by Opta Sports.

The New York Times on Mayor Bloomberg’s geek squad.

Oscar Boykin at the Northeast Scala Symposium gives a talk Programming isn’t math.

Are the Oxbridge bumps races the longest running Markov Chain Monte Carlo simulation in the world?

How deep is a tennis tournament compared to March Madness?

From the Wall Street Journal: a print article about the use of natural language processing in reinventing the smartphone keyboard and an accompanying interview with Ben Medlock, chief technology officer of SwiftKey.

From the BigML blog, bedtime for boosting.

Chris Wilson of Yahoo Research blogs about social network analysis based on Senate votes. Also at the Washington Post. (Democrats are more cohesive than Republicans.)

Jeff Rosenthal spoke in 2010 at Harvard on How to discuss statistics on live television; this was the inaugural Pickard memorial lecture, which was recently posted on youtube.