Thomas Schelling, in his fascinating book Micromotives and Macrobehavior (pp. 64-65 of the 2006 Norton edition) writes:
Ask people whether they consider themselves above or below average as drivers. Most people rank themselves above. When you tell them that, most of them smile sheepishly.
There are three possibilities. The average they have in mind is an arithmetic mean and if a minority drive badly enough a big majority can be “above average”. Or everybody ranks himself high in qualities he values: careful drivers give weight to care, skillfyl drivers give weight to skill, and those who think that, whatever sle they are not, at least they are polite, give weight to courtest, and come out high on their own scale. (Thsi is the way that every child has the best dog on the block.) Or some of us are kidding ourselves.
I’d long heard something similar in that “75 percent of students entering [insert elite college] think they’ll be in the top quarter of their class”; “top quarter” presumably means top quarter in GPA, so everybody is working on the same scale. But as Schelling points out, people probably judge driving on different scales. And I really don’t think people think intuitively in terms of means in the driving case; that requires doing arithmetic on numbers that don’t even exist.
So naturally I wondered how strong the effect is. Let’s assume that person 


Now consider someone with, say, 

But now say this person perceives the world around them using a subjective score of the form 


For a general person let 


Here’s a scatterplot of 


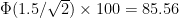
Here’s the distribution of people’s self-perceived ranks, from a simulation of ten thousand individuals. The histogram for objective ranks is nearly flat. The piling up near the right indicates that people are thinking more highly of themselves than would be objectively true. For a very quick measure, in this simulation of 10,000 individuals, 5,937 perceive themselves as above the median.

Here’s the distribution of “perception gaps”, the difference between subjective and objective ranks.

And somewhat surpisingly, about six percent of people have a lower subjective rank than objective rank. This is the “well-rounded” group that has both 


One expects this effect to be stronger if there are more factors to be considered; I’ll save that for another post.

What a fantastic post! I appreciate the insight you can get from running these large simulations.
I’m also reminded of the Dunning-Kruger effect, in which the incompetent are ignorant of their lacking skills, judging themselves to be superior, while the truly competent sometimes judge themselves more harshly. It’s interesting that a “self-centered” subjective ranking like the one you’re describing can produce similar effects, without the explanation by ignorance.
“I really don’t think people think intuitively in terms of means in the driving case; that requires doing arithmetic on numbers that don’t even exist.”
That, apparently, is how psychologists currently explain this phenomenon. The question asked is hard, requiring mental effort to compute an answer. If one actually attempted this computation, one would find that the necessary data is missing. But the answer given is indeed intuitive and the intuition is arrived at by substituting an easier question: how hard is driving? Driving is pretty darn easy, so most people think of themselves as “good” drivers. That is why if you ask a similar question for a harder task, you get the opposite effect. For example, most people are likely to say that they are worse than average at engaging a stranger in conversation.
Unfortunately, this explanation does not lead immediately to such an interesting simulation! However, it does have a probability connection, because it can be viewed as an example of base rate fallacy.
“since their x is higher than their y, they naturally assume x is the more important trait, following Schelling”
I would actually expect the opposite causality: A major reason for a person having a higher x is assigning more weight and therefore more effort to it.
Apparent Overconfidence
Click to access Apparentfinal.pdf
I’d long heard something similar in that “75 percent of students entering [insert elite college] think they’ll be in the top quarter of their class”; “top quarter” presumably means top quarter in GPA, so everybody is working on the same scale.There are blatant imbalances of power in Australia. For exampleHay Day Hack Tool APK – Diamonds
i had been looking out for website for msp games here.
free resources of msp