Tom Tango, while writing about lineup construction in baseball, pointed out that batters batting closer to the top of the batting order have a greater chance of setting records that are based on counting something – for example, Chris Davis’ chase for 62 home runs. (It’s interesting that enough people see Roger Maris’ 61 as the “real” record that 62 is a big deal.) He observes that over a 162-game season, each slot further down in the batting order (of 9) means 18 fewer plate appearances.
Implicitly this means that every slot in the batting order is equally likely to end the game — that is, that the number of plate appearances for a team in a game, mod 9, is uniformly distributed over {0, 1, …, 8}.
Can we check this? There are two ways to check it:
- 1. find the number of plate appearances in every game. This is boring.
- 2. come up with a model for the number of plate appearances in a game and see what comes out. This is exciting.
We need some basic statistics. From baseball-reference.com’s 2012 MLB season page on batting, we can find out that last year there were 184,179 plate appearances. From the season pitching page we learn there were 43,355 and a third innings pitched; at three outs per inning that’s 130,066 outs. So 70.6% of plate appearances include an out; 29.4% don’t. (I’m simplifying here in not accounting for double or triple plays, which come on plate appearances with more than one out.)
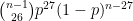
The question then boils down to: how many plate appearances does it take to get 27 outs? (Again, I’m simplifying: sometimes the home team doesn’t bat in the bottom of the ninth, there are extra innings, about which you should read this paper by Darren Glass and Philip Lowry, and so on.) That’s given by one parameterization of the negative binomial distribution. Let’s have the following model of baseball:
- The game consists of a series of plate appearances.
- Assume that any plate appearance has probability 1-p = 0.294 of no outs, and p = 0.706 of one out.
- When you get 27 outs, the game is over.
- Nobody keeps score. This isn’t real baseball.
Then what’s the probability that the game ends on the nth plate appearance, for any 


(Incidentally, if we set 
It turns out that a baseball game is not quite long enough to get the distribution to totally equalize. Here’s a plot of the distribution of the number of plate appearances per game:
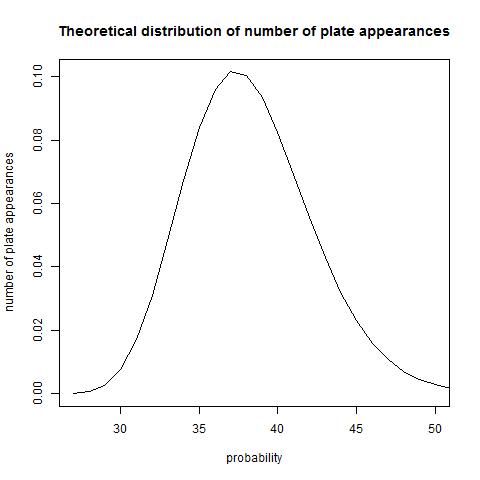
The distribution is not incredibly wide – the standard deivation is 3.99. Is this wide enough to get uniformity mod 9? Not quite. In the plot below, the red, green, and blue lines represent the probability of the game ending in the fourth, fifth, and sixth times through the order (28-36, 37-45, and 46-54 plate appearances, respectively), with the batter in the slot indicated on the x axis. The black line is the overall probability of ending on a given slot – the sum of the red, green, and blue lines, plus some other lines that are suppressed (games with 27 plate appearances, or 54 or more) that are graphically indistinguishable from zero.

The probability of the game ending with a batter in the kth slot in the order is given by the table below:
| slot number | 1 | 2 | 3 | 4 | 5 | 6 | 7 | 8 | 9 |
| prrobability | .118 | .114 | .108 | .104 | .103 | .106 | .111 | .116 | .120 |
So the distribution is visibly not flat – but flat enough for Tango’s practical insight to make sense. Maybe moving someone up is expected to get them 17 extra plate appearances, or 19, instead of 18, depending on the slot. But the point still stands. In practice the distribution of the final slot is probably even flatter than it appears here – the distribution of the number of plate appearances should be wider, since teams differ in skill, there are extra-inning games or games in which the home team doesn’t bat in the ninth, and so on.

Reblogged this on nebusresearch and commented:
The God Plays Dice blog has a nice piece attempting to model a baseball question. Baseball is wonderful for all kinds of mathematics questions, partly because the game has since its creation kept data about the plays made, partly because the game breaks its action neatly into discrete units with well-defined outcomes.
Here, Dr Michael Lugo ponders whether games are more likely to end at any particular spot in the batting order. Lugo points out that certainly we could just count where games actually end, since baseball records are enough to make an estimate from that route possible. But that’s tedious, and it’s easier to work out a simple model and see what that suggests. Lupo also uses the number of perfect games as a test of whether the model is remotely plausible, and a test like this — a simple check to whether the scheme could possibly tell us something meaningful — is worth doing whenever one builds a model of something interesting.
Also one thing that might skew the (reality)( numbers is that those batters towards the end of the order (7th-9th) are typically not as good of batters, and are therefore more likely to get outs than random chance; Whereas batters 1-2 are high ‘percentage’ batters and 3-4 are ‘power’ batters, and theoretically less likely to get those outs.
Chiaroscuro: you’re absolutely right about that! If I were to refine this simulation model I’d bring in some data about the on-base percentages that are typical for various slots in the batting order. I might start by doing this just for the American League – the pitcher bats in the NL but due to the use of relief pitchers in today’s game, when the 9th slot comes up to end the game it’s essentially always a pinch hitter.
Also, a general comment: apparently Sean Lahman’s baseball database has been wrapped up in an R package! (http://blog.revolutionanalytics.com/2013/04/lahman-a-new-r-package-for-baseball-stats.html) This will make the workflow for these sorts of analyses a lot easier.
> GAME NAME :VEGAS SLOTS CASINO:
> GET 2000 FREE COINS EVERY 4 HOURS,TRY YOUR LUCK SPINNING THE REEL,FIND
> HIDDEN RARES TO UNLOCK THE GAMES NEXT LEVELS
http://www.freeclickgames.biz
There’s definately a lot to know about this subject. I love all of the points you have made.
If you’ren’t making time for this, anyone run the danger
of planning to the store to simply understand that you missed your likelihood on saving cash.