David Radcliffe asks for an explanation of the “bands” in the scatterplot of the number of solutions to p + q = 2n in primes. To give an example, we have
2 × 14 = 28 = 23 + 5 = 17 + 11 = 11 + 17 = 5 + 23
2 × 15 = 30 = 23 + 7 = 19 + 11 = 17 + 13 = 13 + 17 = 11 + 19 = 7 + 23
2 × 16 = 32 = 29 + 3 = 19 + 13 = 13 + 19 = 3 + 29
and so, denoting this function by f, the elements of this sequence corresponding to n = 14, 15, 16 are f(14) = 4, f(15) = 6, and f(16) = 4 respectively. (Note that the counts here are of ordered sums, with 23 + 5 and 5 + 23 both counting; if you use unordered sums everything works out pretty much the same way, since every sum except those like p + p appears twice and I’m going to talk about ratios and inequalities and the like.)
My re-rendering of something similar to the original scatterplot is here:

and there are heuristic arguments that 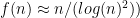
There are definitely bands in these plots. Indeed the situation for n = 14, 15, 16 is typical: f(n) “tends to be” larger when n is divisible by 3 than when it isn’t. A handwaving justification for this is as follows: consider primes modulo 3. All primes (with the trivial exceptions of 2 and 3) are congruent to 1 or 5 modulo 6, and by the prime number theorem for arithmetic progressions these are equally likely. (For some data on this, see Granville and Martin on prime races, which is a nice expository paper.) So if we add two primes p and q together, there are four equally likely cases:
- p is of form 3n+1, q is of form 3n+1, p+q is of form 3n+2
- p is of form 3n+1, q is of form 3n+2, p+q is of form 3n
- p is of form 3n22, q is of form 3n+1, p+q is of form 3n
- p is of form 3n+5, q is of form 3n+2, p+q is of form 3n+1
So if we just add primes together, we get multiples of three fully half the time, and the remaining half of the results are evenly split between integers of forms 3n+2 and 3n+1.
We can make the bands “go away” by plotting, instead of 


Naturally we look to the next prime, 5. A given prime is equally likely to be of the form 5n+1, 5n+2, 5n+3, or 5n+4; if we work through the combinations we can see that there are 4 ways to pair these up to get a multiple of 5, and 3 ways to get each of the forms 5n+1, 5n+2, 5n+3, 5n+4. So it seems natural to penalize multiples of 5 by multiplying their $f(n)$ by 3/4; the banding then is even less strong, as you can see below.

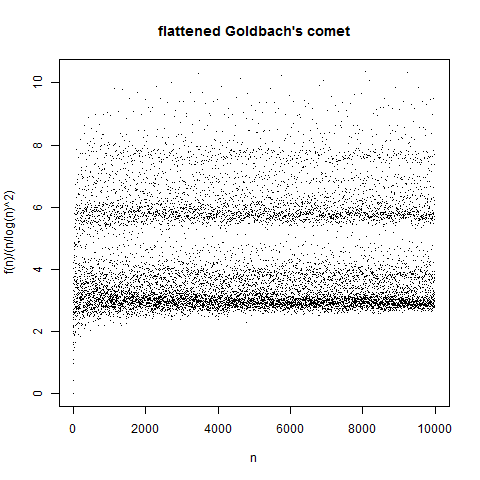
The natural thing to do here is to just iterate over primes. For the prime 


in this case you get the plot below. The lack of banding in this plot is basically the extended Goldbach conjecture.
Although I didn’t know this when I started writing, apparently this is known as Goldbach’s comet: see e. g. Richard Tobin or Ben Vitale or this MathOverflow post.
And although this is a number-theoretic problem, much of this is an exercise in statistical model fitting; I proceeded by making a plot, checking out the residuals compared to some model to see if there was a pattern, and fitting a new model which accounted for those residuals. However, in this case there was a strong theory backing me up, so this is, thankfully, not a pure data mining exercise.
