FiveThirtyEight currently gives Joe Biden an 88% chance of winning the US presidential election, and Donald Trump 12%.
The Economist gives Biden 92, Trump 7.
Both have Biden ahead by 8.4 percent in the popular vote. FiveThirtyEight has 53.6 to 45.2 (with 1.2 percent to third parties), while the Economist has 54.2 to 45.8 (with no third parties – I presume they’re measuring share o the two-party vote). My assumption is that the difference in these odds is due to FiveThirtyEight’s model putting a larger correlation between states than the Economist’s, and therefore giving a wider distribution around that center point.
Both sites also have a model of the Senate election. FiveThirtyEight expects the Democrats to have 51.5 seats after the election, with a 74% chance of control; the Economist expects 52.5 seats for the Democrats, with a 76% chance of control. Recall that if the Senate is tied, 50-50, then the Vice President (Kamala Harris for the Democrats, or Mike Pence for the Republicans) breaks the tie; that is, Senate control belongs to the party holding the White House. So what do the models say about that tie?
FiveThirtyEight presents the diagram below, where the 50/50 bar is split between the parties:

If you hover over the red part of the 50-50 bar you get “1.7% chance” (of a 50-50 Senate and Republican president); if you hover over the blue part you get “11.2% chance” (of a 50-50 Senate and Democratic president). That is, conditional on a 50-50 Senate, FiveThirtyEight gives a probability of 0.112/0.129, or about 87%, of a Democratic president. (This is different from the 88% figure above.)
The Economist, on the other hand, explicitly says that conditional on a 50-50 Senate, there’s an 18% chance of a Democratic presidency:

Which one of these probabilities is more realistic? Where do they come from?
The Economist writes, on their methodology page:
In presidential-election years, the model also simulates which party will control the vice-presidency, which casts the tiebreaking vote in case of a 50-50 split, based on the simulated national popular vote for the House.
FiveThirtyEight’s Senate forecast methodology page doesn’t seem to make a statement about this; they mention that the 2020 Senate model is “mostly unchanged since 2018”, and of course there was no presidential election in 2018.
My instinct is that 50-50 is a bad night for Democrats. The Democrats start with 35 seats not up re-election. Both sites agree on the 15 most Democratic-leaning Senate seats that are up for election. So let’s say that Democrats win those 15 states and no others, for a 50-50 Senate. For the sake of argument, assume that every state that has a Senate seat up for grabs chooses the same party for the Senate and the presidency. So let’s fill in an Electoral College map with those 15 states in blue, and the nineteen other states with Senate seats at stake in red, to get the map below. (15 + 19 = 34, you say? Well, Georgia has two Senate seats at stake.)
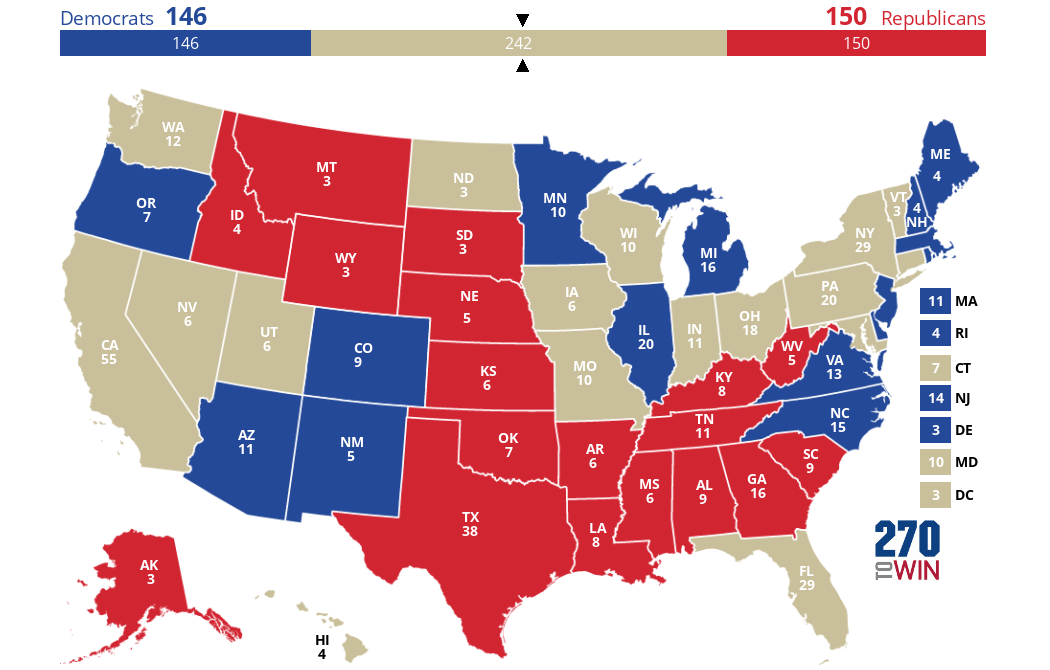
 Click the map to create your own at
 Next let’s fill in those states that don’t have a Senate election, but are safe for one party or the other. For the Democrats, California, Washington, Hawaii, New York, Maryland, Vermont, Connecticut (and DC). For the Republicans, Utah, North Dakota, Missouri, and Indiana. (I’m old enough to remember when Missouri was a swing state.) Here’s the map you get.
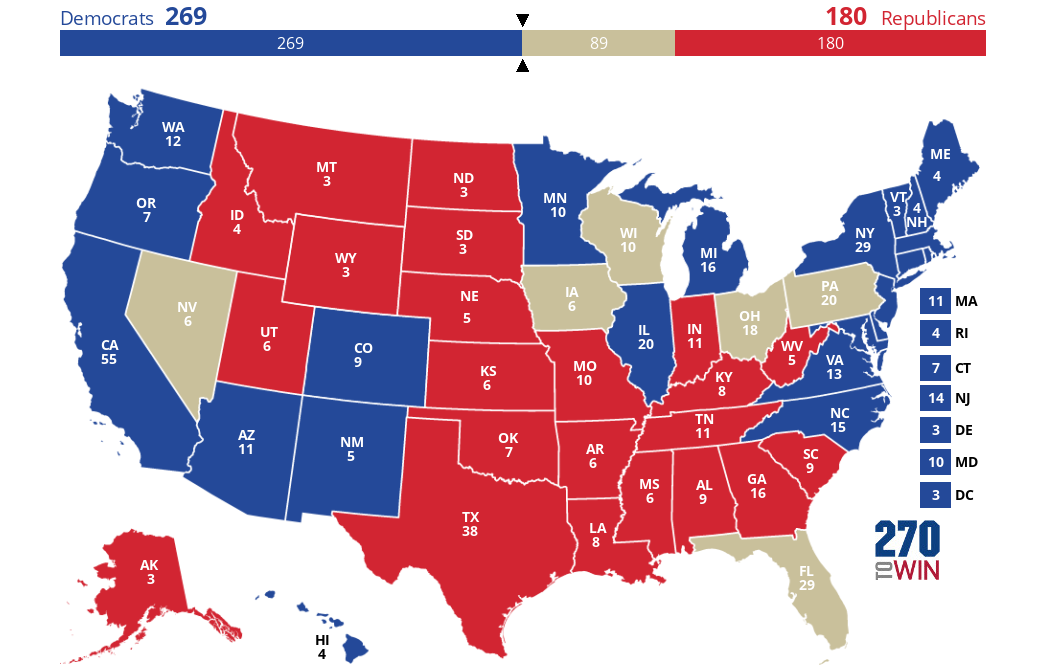
So in a world where the Senate is 50-50 in what is probably the most likely way, it looks like the Democrats are right on the cusp of winning the presidency – FiveThirtyEight is probably right after all, to color the 50-50 bar mostly blue. I just hope we don’t get that 269-269 map, partially because it’ll be exhausting and partially because then I should have written a post on how a tied Electoral College gets thrown to the house instead of writing this one.

Unless 538 and the Economist have completely retooled since the last election, why should we pay attention to anything they say? I’m not trying to troll here—honest question. I’m stunned at the audacity of these people after getting it so very, very wrong.
I don’t think predictions on the order of 30% coming true qualify as “very, very wrong”. The models that predicted with 98% confidence outcomes that didn’t come to pass, sure – one can rightfully criticize such models (if they do not have a track record of 50ish previous successful 98% predictions, anyway). But predictions with 70% confidence should come true, well, 70% of the time. You’d expect results which are that surprising more than once every 4 elections. IIRC, the Trump campaign’s internal models had similar predictions as of election day – sometimes the balance of evidence really does lean moderately in one direction, and sometimes the outcomes happen to be on the slightly-less-likely side of that evidence. 538 wasn’t “wrong” in 2016 any more than a “7% chance of rain” forecast is wrong every two weeks – that’s just what 7% means!
By that logic, if 538 didn’t get it “wrong” in 2016, then they’ve never gotten anything “right” either, correct?
In September of 2015, Nate Silver told Anderson Cooper that Trump had a less than 5% chance of winning the nomination. A few months later, he doubled down, posting his “Dear Media, Stop Freaking Out About Donald Trump’s Polls” article when Trump’s numbers were rising.
Welp, Trump won the nomination. And Silver ate a little crow, publicly, which I respect.
It’s true, 538 did have Trump at around 30%, much higher than most of the other pollsters and pundits, and he did pretty well predicting the national vote margin. So hat’s off to him on that.
But of course as we all know, the popular vote doesn’t mean any more than “yards gained” in a football game. 2016 was all about FL, PA, MI, and WI. On election day, 538 had Hillary favored in all four states. Specifically, they gave Hillary a 55% chance in Florida, 83% in Wisconsin, 77% in Pennsylvania, and 79% in Michigan.
On election night, Silver called Trump’s win “the most shocking political development of my lifetime”.