Ork Posters makes maps of cities with their neighborhoods. I have three: Boston, Philadelphia, San Francisco. I was looking at them recently and noticed one thing these three cities have in common: the more centrally located neighborhoods are physically smaller than the outlying neighborhoods.
Is this a general trend? It’s hard to tell because neighborhoods don’t “officially” exist. Perhaps we can do something similar looking at states.
The first question is: what’s the “central” location to use? Since states have historically been formed from the capital, i. e. Washington, DC, I plotted land area against the distance from the state’s largest city to DC. (This was the driving distance as given on Google Maps, except for Hawaii where I used flight distance from gcmap.com.)
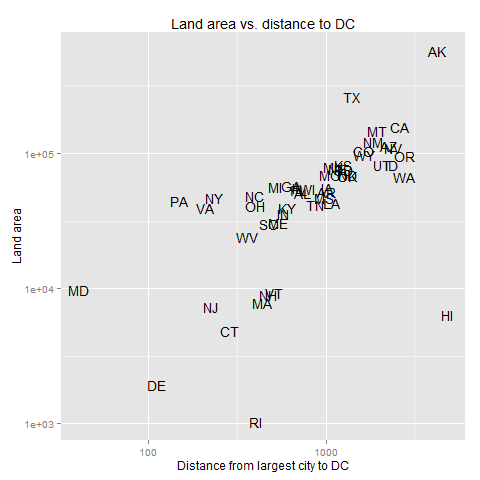
This confirms what you see on a map – states get bigger as you move away from the capital. There are basically two clusters:
– the “main” cluster stretching from Pennsylvania to California;
– the “northeastern” cluster, where states are smaller than you’d expect from their distance to DC.
The existence of this “northeastern” cluster suggests that it might have made more sense to use a point further north – Philadelphia or even New York – for these earlier states. These states were formed as colonies, before the United States had a capital or was even a thing – but New York and Philadelphia both had their turns as capital before Washington, DC existed.
As you probably could have guessed beforehand if you know anything about the United States, Texas, Alaska, and Hawaii are outliers.
More distant states turn out also to have lower population. (Not just lower population density.)
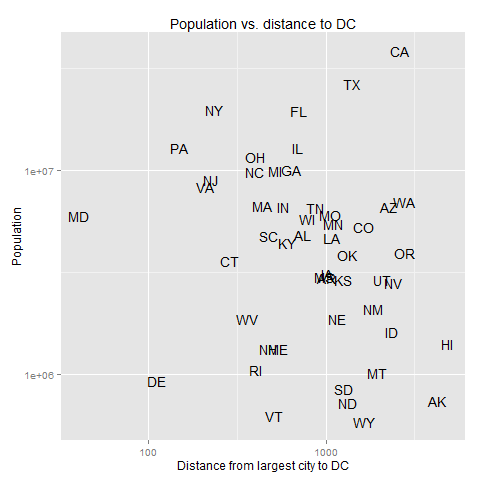
Incidentally, at the county level, Ed Stephan observed that some states have variation in county size and some don’t, and that much of this seems to be explainable by population density changes. So it is very possible that the observation that more remote states tend to be larger may hold because remoteness from DC, in the United States, is correlated with lower population density. That’s a fancy way of saying that as you go west there are less people, which if you ignore the western coast is true.
As for my original question: how would you answer it, given that there aren’t official definitions of neighborhoods?

Hi fellas, just want to say – don’t pay $500 for platinum roulette system, you can find it for free,
just type in google – Platinum roulette system that
works – you will find interesting post about this system
Ich bin wirklich gespannt wie es da zugeht! Mal schauen ob die girls dort auch Sciuounhflrmen tragen … Diesen Kommentar finde ich gut oder finde ich nicht gut: 1 3
What office would have authority to define a neighborhood? And how would you know it was defined right?
I’d think that using, say, the definitions of neighborhoods that local newspapers apply when describing where stuff happened is probably good enough for this kind of project. There’ll be some disagreements about, say, whether South Foster Street belongs more in Eastside or East Town [1], but, there’s inevitably some error margin in measuring the size of neighborhoods.
It could make the case for a correlation between distance-from-city-center and size-of-neighborhood if different sources of neighborhood boundaries (say, the newspaper, the taxi zone maps, the neighborhood organizations) can be used. If there is a distance-area relationship with different sources’ ideas of neighborhood areas it argues that it’s a substantial thing.
[1] I kid, of course. `East Town’? Ridiculous marketing attempt to split up Eastside. Tch.
Mark Stein’s How The States Got Their Shapes describes, well, it’s right there on the cover. It turns out pretty much every state has an interesting story behind its boundaries. But he also points out that when the United States got to defining state boundaries the Congress seems to have had an idea that if a group of states were carved out of a particular region their areas should be roughly equal, and so, for example, Georgia, Alabama, and Mississippi are fairly close in size to one another; as are North Dakota, South Dakota, Nebraska, and Kansas; Washington and Oregon, ditto.
The 13 colonies were dramatically non-equal in size, and there were (largely) political reasons behind that which Stein describes pretty well.